

WALES.ORG RESEARCH · Part of the Wales.org Research Series
Wales’s Holiday-Let Hotspots Are Mid-Table on Housing Affordability

Wales’s second homes and holiday lets are usually discussed alongside a bigger question: can local people still afford to buy where they live? This report puts the two side by side. For all 22 councils, it sets the official house price to pay ratio against the share of homes that are second homes or business-rated holiday lets.
The expectation would be that the councils with the most holiday properties are the hardest places to buy. The figures are more mixed. The three councils where more than 8% of homes are second homes or holiday lets, Gwynedd, Pembrokeshire and Anglesey, sit in the middle of the table, close to the Wales average. The least affordable are Monmouthshire, the Vale of Glamorgan and Powys.
This report takes no position on second homes, holiday lets or housing policy. It sets out what the official figures show, and where they are limited. It builds on our reports on second homes, the visitor levy and holiday lets.
Key findings
- Affordability has improved since 2021. A median home in Wales cost 5.95 times median full-time pay in 2025, down from 6.57 in 2021, the highest since 2007. The ONS summary rounds the 2025 figure to 6.0. The ONS says the fall from 2024 is not statistically significant.
- The least affordable councils are Monmouthshire (7.98), the Vale of Glamorgan (7.87) and Powys (7.86). The most affordable are Blaenau Gwent (4.34), Neath Port Talbot (4.41) and Merthyr Tydfil (4.57).
- The holiday-property hotspots are mid-table. Gwynedd (11.3% of homes are second homes or business-rated holiday lets), Pembrokeshire (9.2%) and Anglesey (8.9%) rank 12th, 8th and 9th of 22 for how unaffordable they are, at 5.89, 6.15 and 6.12 times pay.
- All three are more affordable than in 2019, by 0.74, 1.00 and 0.65 points, while Wales as a whole is 0.12 points less affordable. Pay estimates for these councils rose faster than prices over the period.
- Across all 22 councils there is a loose link. Councils with more holiday properties tend to have higher ratios (a rank correlation of about 0.5). The link does not depend on the top three, and it weakens when Ceredigion, Conwy and Powys are also set aside.
- Where people live and where they work can tell different stories. In Powys, residents’ median full-time pay is 15% higher than that of people who work there, so homes cost 7.86 times workers’ pay but 6.82 times residents’ pay.
How affordability is measured
The Office for National Statistics (ONS) divides the median price paid for homes in each council by median gross annual full-time pay. A ratio of 6 means a typical home costs six times a typical full-time salary. Prices cover sales in the year to September 2025 and pay is from April 2025.
The ONS publishes the ratio two ways. The workplace-based version uses the pay of people who work in the council, whether or not they live there. The residence-based version uses the pay of people who live there, wherever they work. It also publishes a lower-quartile version, comparing the cheapest quarter of homes with the lowest-paid quarter of earners, which is often used as a guide to the entry-level market. This report uses the workplace-based median as its headline and shows the others in Table 1.
For Wales as a whole, the median home sold for £213,000 and median full-time workplace pay was about £35,800, giving 5.95. On the residence-based measure the figure is 5.86.
Where homes cost the most and least compared with pay

Ten of the 22 councils are above the Wales figure. Monmouthshire has the highest ratio at 7.98, followed by the Vale of Glamorgan (7.87) and Powys (7.86). Cardiff (6.96), Ceredigion (6.93) and Conwy (6.77) complete the top six. At the other end, Blaenau Gwent (4.34), Neath Port Talbot (4.41) and Merthyr Tydfil (4.57) are the most affordable, with homes costing between 4.3 and 4.6 times pay. Monmouthshire’s ratio is about 1.8 times Blaenau Gwent’s.
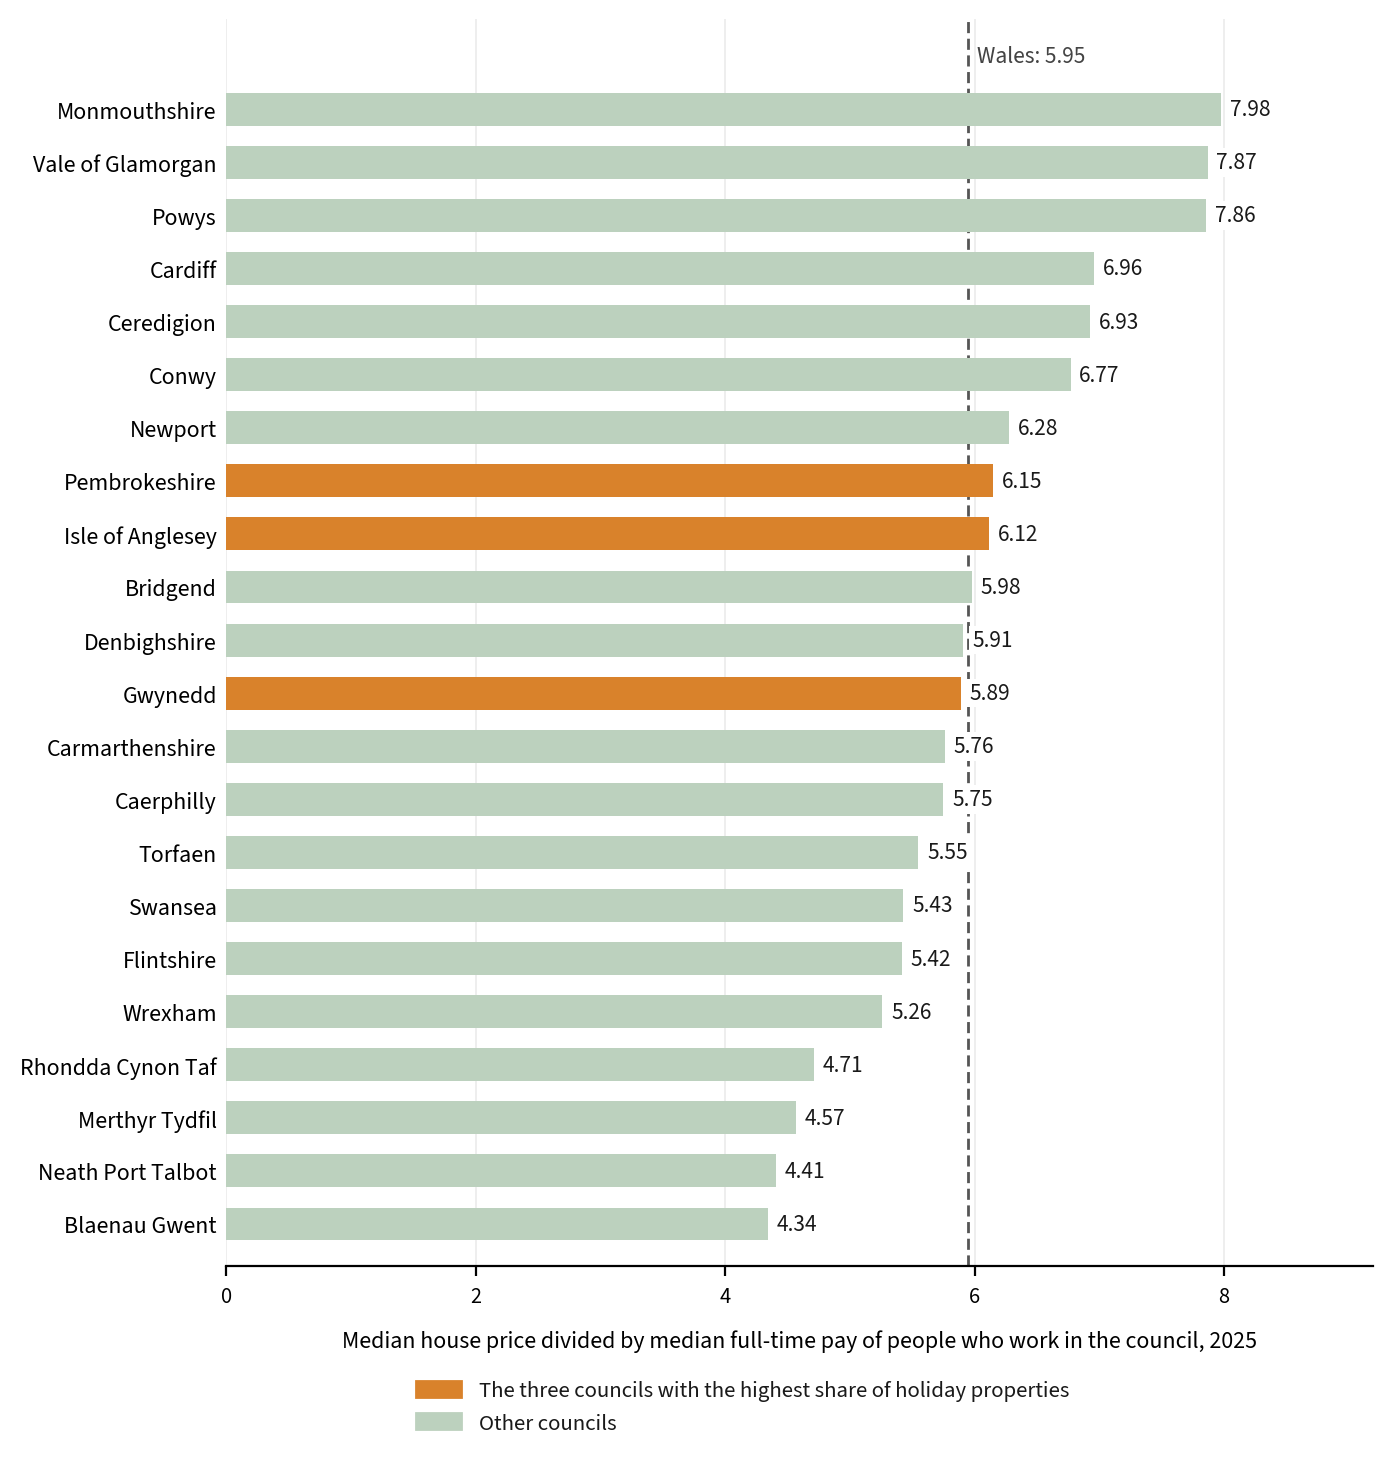
Figure 1. Median house price divided by median full-time pay of people who work in the council, 2025. The dashed line is the Wales figure (5.95). Source: ONS, Housing affordability in England and Wales: 2025.
On the lower-quartile measure, which compares entry-level homes with entry-level pay, Monmouthshire is again the least affordable (8.18), followed by the Vale of Glamorgan (7.69), Cardiff (6.69) and Powys (6.67). The Wales figure on this measure is 5.56.
Are holiday-let hotspots the least affordable?
To test the question, we measured holiday properties as a share of each council’s homes. We added chargeable second homes (council tax, 2026–27) to holiday lets on the business rates list (31 March 2026), and divided by all chargeable homes plus those holiday lets. On that measure, Wales has 2.4% holiday properties. Gwynedd has the most at 11.3%, roughly one home in nine, followed by Pembrokeshire (9.2%), Anglesey (8.9%), Ceredigion (5.9%), Conwy (3.8%) and Powys (3.5%). Only Gwynedd, Pembrokeshire and Anglesey are above 8%, and we call those three the hotspots in this report. In 15 councils the share is under 2%.
Those top three are not the hardest places to buy. Pembrokeshire (6.15) and Anglesey (6.12) are a little above the Wales figure; Gwynedd (5.89) is a little below it. Their residence-based ratios (6.15, 6.24 and 5.86) tell the same story. Across all 22 councils, though, there is a loose positive link between holiday-property share and the ratio, with a rank correlation of about 0.5. It does not depend on the top three: without Gwynedd, Pembrokeshire and Anglesey the correlation is slightly higher (0.56). Ceredigion, Conwy and Powys, which have between 3% and 6% holiday properties and ratios between 6.77 and 7.86, contribute to it; with all six set aside it falls to 0.41, too weak to rely on with only 16 councils. A link across 22 councils does not show that holiday properties raise the ratio: coastal and rural councils differ from industrial ones in many other ways.
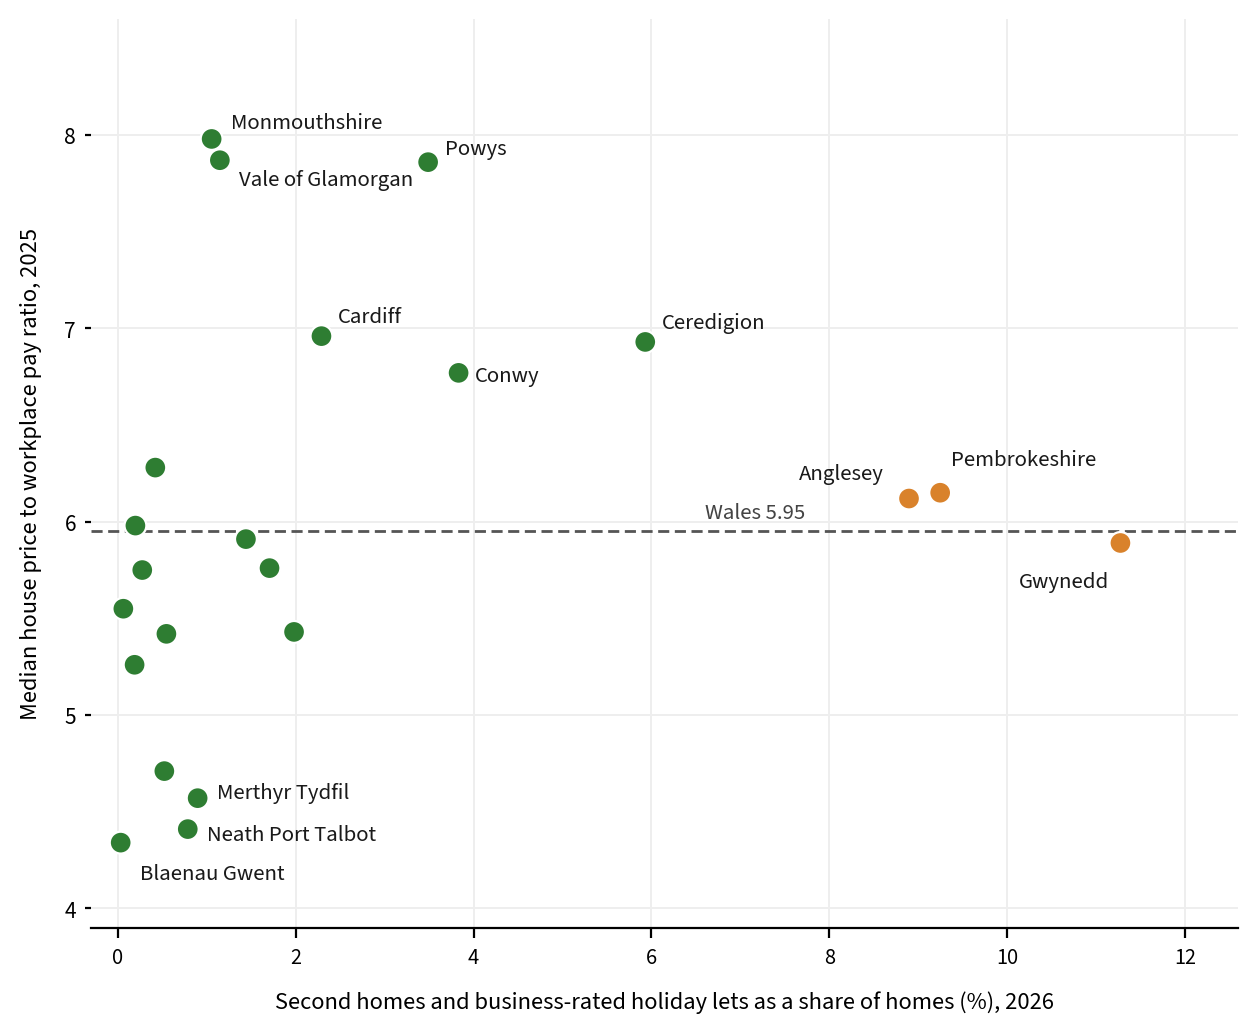
Figure 2. Second homes plus business-rated holiday lets as a share of homes (2026) against the median house price to workplace pay ratio (2025), by council. The dashed line is the Wales figure. Sources: ONS; StatsWales; HMRC Valuation Office.
Pay where you live versus pay where you work
The two versions of the ratio differ because people who live in a council do not always work in it. Where residents out-earn the people who work locally, for example because many commute out to better-paid jobs elsewhere, the workplace-based ratio looks worse than the position of the people actually living there.
That gap is largest in Powys, where residents’ median full-time pay is £35,909, compared with £31,163 for people who work there (+15%). Merthyr Tydfil (+15%) and Carmarthenshire (+13%) follow, then the Vale of Glamorgan, Conwy and Torfaen, each around +9% to +10%. The reverse is true in Wrexham, Flintshire and Cardiff, where people who work in the council earn more than those who live in it. In the three holiday-property hotspots the difference is negligible, within about two percentage points either way.
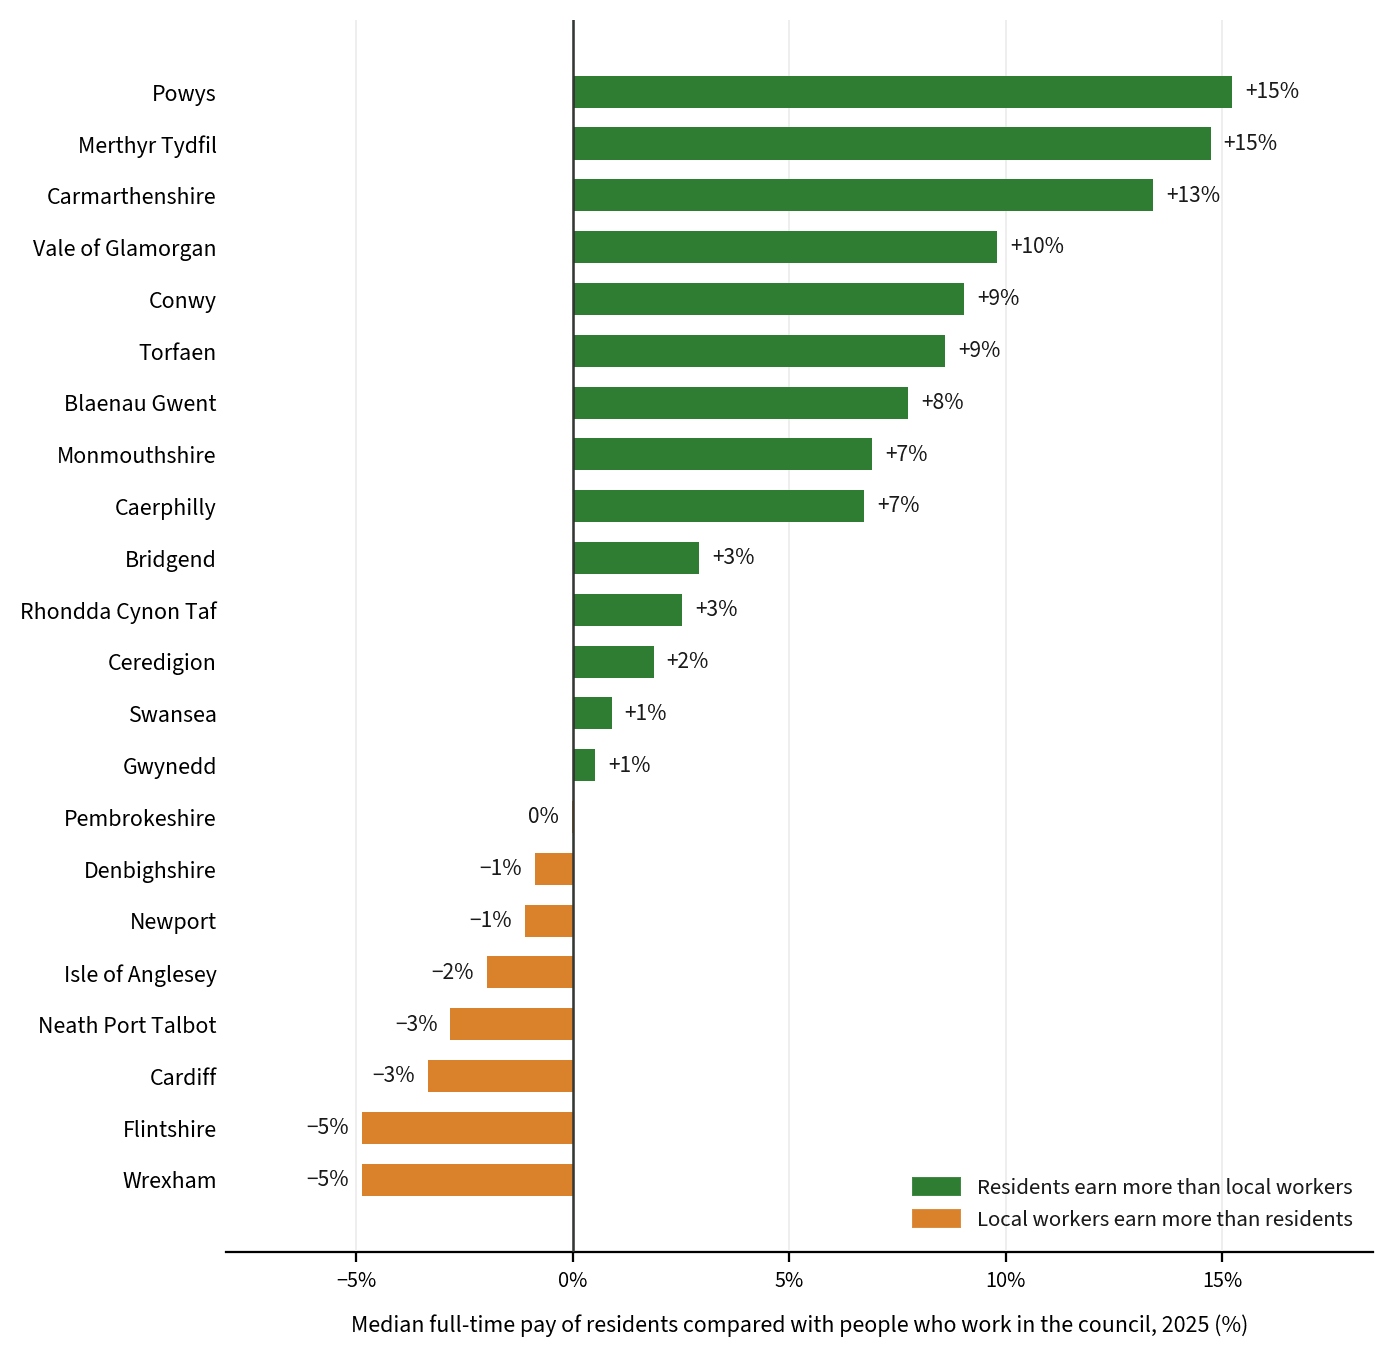
Figure 3. Median full-time pay of residents compared with people who work in the council, 2025. Source: ONS, Housing affordability in England and Wales: 2025 (residence-based and workplace-based earnings).
Has affordability got better?
Nationally, yes, from a high base. The Wales ratio rose from 5.83 in 2019 to 6.57 in 2021, its highest since 2007, then fell each year to 5.95 in 2025. Nineteen of the 22 councils are more affordable than in 2021. Measured from 2019, though, only 10 are, and Wales as a whole is 0.12 points higher.
The three holiday-property hotspots are among those that have improved since 2019. Gwynedd has gone from 6.63 to 5.89, Pembrokeshire from 7.15 to 6.15 and Anglesey from 6.77 to 6.12. In each, the ONS estimate of median full-time pay rose by more than prices between 2019 and 2025: pay by 37%, 52% and 45%, against prices up 22%, 30% and 31%. For Wales as a whole, pay rose 30% and prices 33%. Pay estimates for individual councils come from a sample survey and can move sharply from year to year, so these changes are best read as direction rather than precise size.
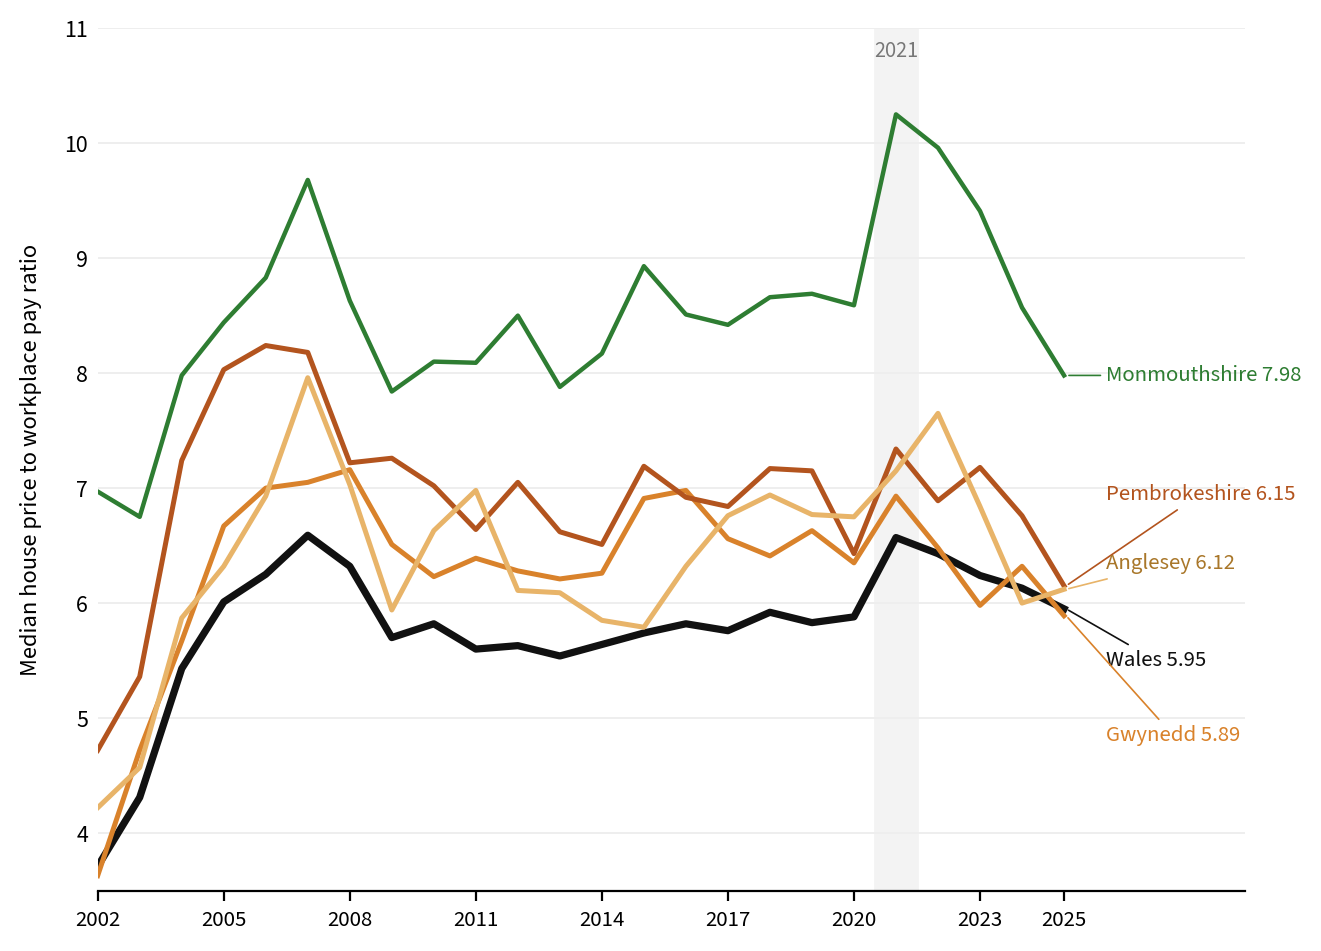
Figure 4. Median house price to workplace pay ratio, 2002 to 2025, for Wales, the three holiday-property hotspots and Monmouthshire. Source: ONS, Housing affordability in England and Wales: 2025.
What prices are doing now
The ONS affordability figures run to 2025. More recent prices come from the UK House Price Index, which shows the average price of a Welsh home at £216,000 in August 2026, up 3.1% on a year earlier, faster than in England (0.4%), Scotland (2.9%) or the UK as a whole (0.9%). Prices rose in 16 of the 22 councils and fell in 6.
Denbighshire had the biggest rise (+5.2%), followed by Rhondda Cynon Taf (+4.9%), Caerphilly (+4.4%) and Gwynedd (+4.1%). Among the councils with the most holiday properties, prices fell in Pembrokeshire (−2.5%), Ceredigion (−1.7%) and Anglesey (−0.4%). Monmouthshire has the highest average price (£328,937) and Blaenau Gwent the lowest (£143,243). Council-level figures for the latest month are provisional, based on a share of sales still to be registered, and can be revised.
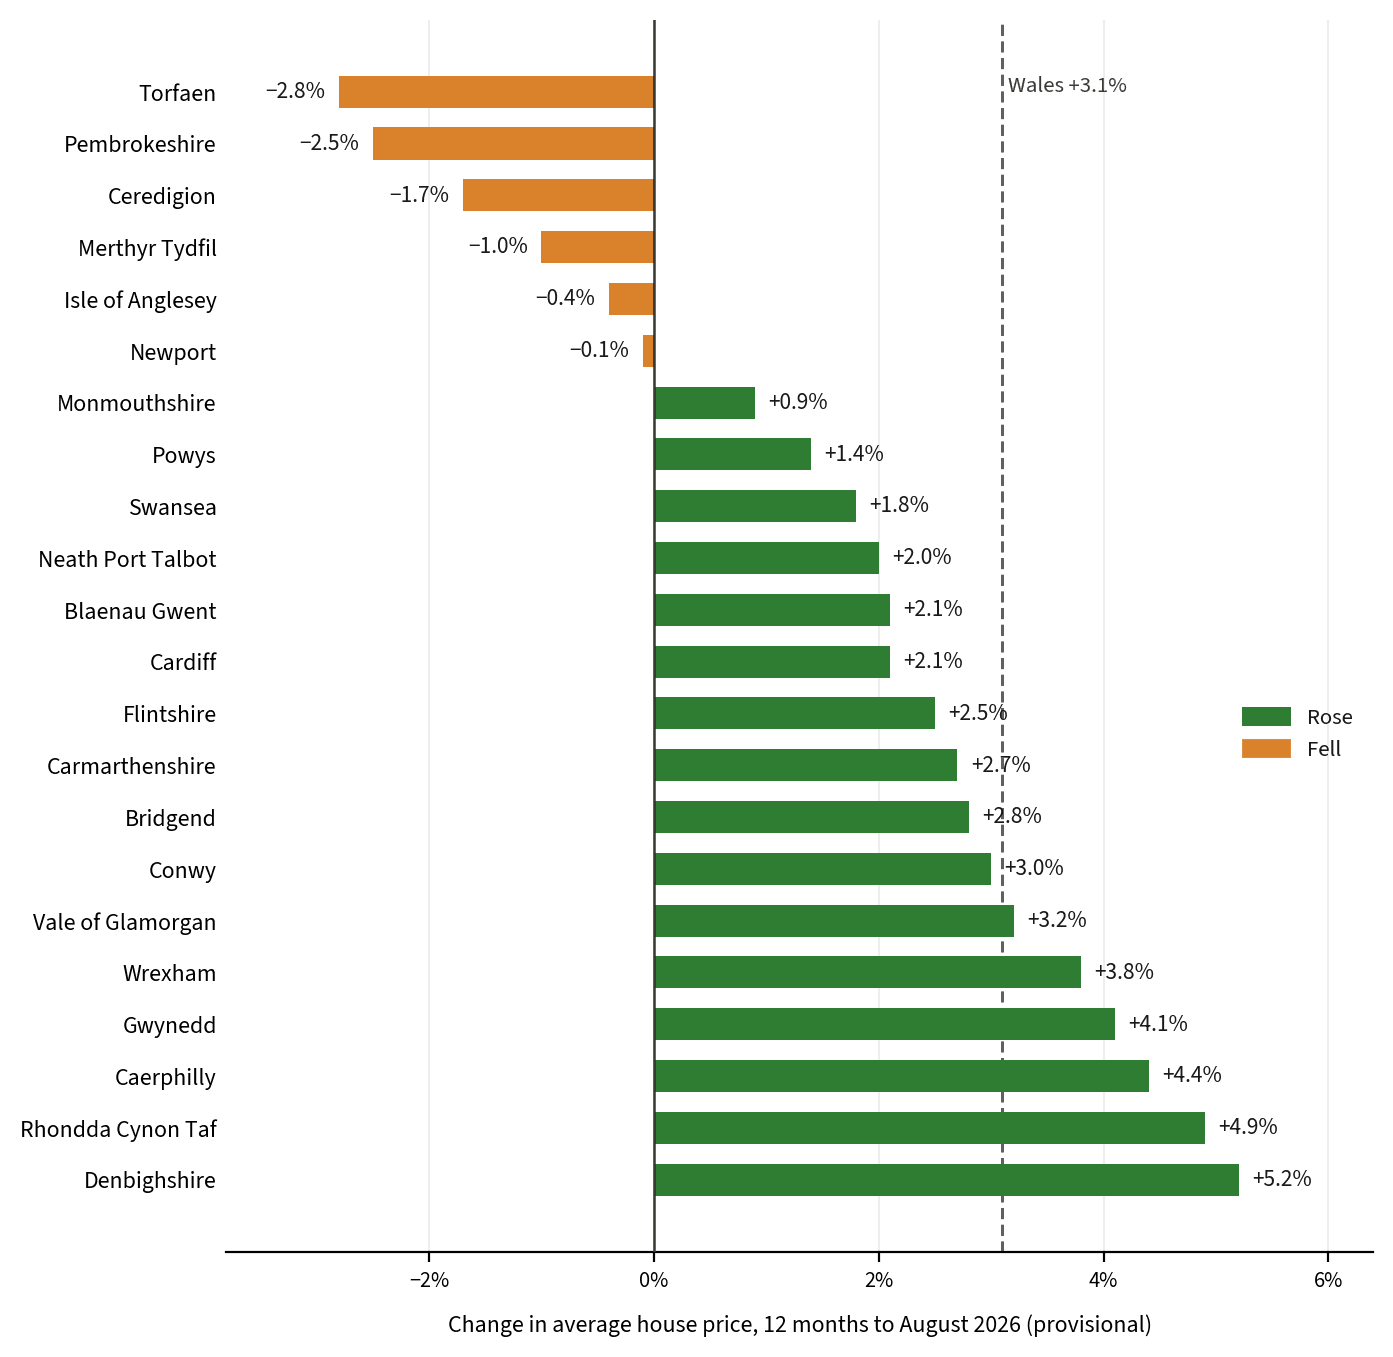
Figure 5. Change in the average house price, 12 months to August 2026 (provisional), by council. The dashed line is the Wales figure (+3.1%). Source: ONS and HM Land Registry, UK House Price Index.
What the data can and cannot tell us
- It compares prices with individual pay, not household income. Many households have two earners, so the ratio can overstate the burden for couples and understate it for people living alone.
- It cannot show who is buying. The pay figures are for people who work or live in the council. They do not include the earnings of out-of-area buyers, who may be buying second homes or holiday lets, so the ratio does not measure how those purchases affect local buyers.
- Council pay estimates are survey-based. They can swing from year to year, especially in smaller councils, so small differences between neighbouring councils, and single-year changes, should not be over-read. The ONS describes the 2024 to 2025 change for Wales as not statistically significant.
- Median prices reflect what sold. Where few homes sell, the median can be volatile, and it says nothing about homes that did not come to market.
- The datasets are measured at different times. Prices and pay are for 2025, holiday properties for 2026 and the latest house price index for August 2026. The 2026–27 council tax figures are councils’ own returns of the dwellings they expect to be liable in the year ahead. The levels in the price index (an average) are not comparable with the ONS median prices.
- A pattern across 22 councils is not proof of cause. Rural, coastal and retirement-area councils differ in many ways that affect prices and pay.
- No forecasts and no policy position. We have not estimated the effect of second homes or holiday lets on prices.
Full data by council
| Council | Holiday properties, % of homes | Median ratio, workplace | Median ratio, residence | Entry-level ratio, workplace | Median ratio 2019 | Change 2019–25 | Average price, Aug 2026 | Price change, 12 months |
|---|---|---|---|---|---|---|---|---|
| Monmouthshire | 1.1 | 7.98 | 7.46 | 8.18 | 8.69 | −0.71 | £328,937 | +0.9% |
| Vale of Glamorgan | 1.1 | 7.87 | 7.17 | 7.69 | 7.87 | 0.00 | £300,358 | +3.2% |
| Powys | 3.5 | 7.86 | 6.82 | 6.67 | 6.90 | +0.96 | £237,042 | +1.4% |
| Cardiff | 2.3 | 6.96 | 7.20 | 6.69 | 7.04 | −0.08 | £272,443 | +2.1% |
| Ceredigion | 5.9 | 6.93 | 6.80 | 6.53 | 7.32 | −0.39 | £234,314 | −1.7% |
| Conwy | 3.8 | 6.77 | 6.21 | 6.37 | 6.83 | −0.06 | £218,235 | +3.0% |
| Newport | 0.4 | 6.28 | 6.35 | 5.94 | 6.18 | +0.10 | £225,702 | −0.1% |
| Pembrokeshire | 9.2 | 6.15 | 6.15 | 5.90 | 7.15 | −1.00 | £211,074 | −2.5% |
| Isle of Anglesey | 8.9 | 6.12 | 6.24 | 5.78 | 6.77 | −0.65 | £236,308 | −0.4% |
| Bridgend | 0.2 | 5.98 | 5.81 | 5.89 | 5.38 | +0.60 | £210,905 | +2.8% |
| Denbighshire | 1.4 | 5.91 | 5.96 | 5.89 | 5.65 | +0.26 | £207,130 | +5.2% |
| Gwynedd | 11.3 | 5.89 | 5.86 | 5.56 | 6.63 | −0.74 | £203,555 | +4.1% |
| Carmarthenshire | 1.7 | 5.76 | 5.08 | 5.18 | 5.53 | +0.23 | £195,263 | +2.7% |
| Caerphilly | 0.3 | 5.75 | 5.39 | 5.56 | 5.09 | +0.66 | £198,545 | +4.4% |
| Torfaen | 0.1 | 5.55 | 5.11 | 5.40 | 5.41 | +0.14 | £194,895 | −2.8% |
| Swansea | 2.0 | 5.43 | 5.38 | 5.18 | 5.51 | −0.08 | £211,177 | +1.8% |
| Flintshire | 0.5 | 5.42 | 5.69 | 5.66 | 5.51 | −0.09 | £214,882 | +2.5% |
| Wrexham | 0.2 | 5.26 | 5.53 | 5.55 | 5.44 | −0.18 | £215,035 | +3.8% |
| Rhondda Cynon Taf | 0.5 | 4.71 | 4.59 | 4.47 | 4.16 | +0.55 | £165,213 | +4.9% |
| Merthyr Tydfil | 0.9 | 4.57 | 3.98 | 4.37 | 4.09 | +0.48 | £148,656 | −1.0% |
| Neath Port Talbot | 0.8 | 4.41 | 4.54 | 4.17 | 3.78 | +0.63 | £165,787 | +2.0% |
| Blaenau Gwent | <0.1 | 4.34 | 4.02 | 4.31 | 3.24 | +1.10 | £143,243 | +2.1% |
| Wales | 2.4 | 5.95 | 5.86 | 5.56 | 5.83 | +0.12 | £216,363 | +3.1% |
Sources and methodology
Sources and periods
- Affordability ratios, prices and pay: Office for National Statistics, Housing affordability in England and Wales: 2025, released 26 March 2026. We use the datasets House price to workplace-based earnings ratio and House price to residence-based earnings ratio: median and lower quartile house prices (year ending September) and median and lower quartile gross annual full-time earnings (April), from House Price Statistics for Small Areas and the Annual Survey of Hours and Earnings.
- Current prices: ONS and HM Land Registry, UK House Price Index: monthly price statistics, 21 October 2026 edition (August 2026, provisional), Wales local authority table.
- Second homes and chargeable dwellings: StatsWales, Council tax dwellings by authority and band, band “Total”, row H8 (“Total chargeable second homes”) and row A1 (“All chargeable dwellings”), 2026–27. The Welsh Government’s Council Tax dwellings: April 2026 to March 2027 release gives the all-Wales total of 1,433,016 chargeable dwellings.
- Holiday lets on the business rates list: HMRC (Valuation Office), Non-domestic rating: stock of properties, March 2026, special category “Holiday Homes Self Catering”, as used in our holiday lets report. Counts are rounded to the nearest 10.
Definitions and calculations
- The affordability ratio is the median house price divided by median gross annual full-time earnings. “Workplace-based” uses the earnings of people who work in the council; “residence-based” uses the earnings of people who live there. The “entry-level” ratio divides the lower-quartile house price by lower-quartile earnings. Rank 1 means least affordable (highest ratio).
- Holiday properties as a share of homes is (chargeable second homes 2026–27 plus business-rated holiday lets at 31 March 2026) divided by (all chargeable dwellings 2026–27 plus business-rated holiday lets). Chargeable dwellings exclude exempt dwellings, so this is a share of chargeable homes and holiday lets, not of every dwelling. The Wales figure uses the Wales totals.
- The rank correlation is a Spearman correlation across the 22 councils between holiday-property share and the workplace-based median ratio (0.52). Without Gwynedd, Pembrokeshire and Anglesey it is 0.56; without Ceredigion, Conwy and Powys, 0.46; without all six, 0.41. With 22 councils it indicates direction only.
- Changes in the ratio are the 2025 value minus the 2019 or 2021 value. Growth in prices and pay is calculated from the ONS median price and median workplace-based earnings for each council. Wales figures come from the ONS country tables.
- Council tax and business rates figures for second homes and holiday lets are described in more detail in our holiday lets report and second homes report.
Contains public sector information licensed under the Open Government Licence v3.0. Analysis and charts by Wales.org.
Part of the Wales.org Research Series. See all our data reports on the Wales Research Hub.
How to cite: Barrett, N. (2026). Wales’s Holiday-Let Hotspots Are Mid-Table on Housing Affordability. Wales.org Research Hub, 29 October 2026. https://wales.org/research/housing-affordability-wales/
Compiled and edited by Nicholas Barrett, founder and editor of Wales.org.

Pembrokeshire-born travel writer and founder of Wales.org. Born in Haverfordwest, now based in Hertfordshire — covering Welsh castles, national parks, festivals and family staycations across all 22 Welsh counties.